With the recent leak about Roe vs Wade, there’s a lot of criticism from the Left about the apparent hypocrisy they see on the Right. For many, Republicans aren’t actually “pro-life,” or even pro-children, if they only care about kids before they’re born but do nothing to fight for their safety and well being after.
However, growing up a conservative Republican (full disclosure: I’m not anymore), I know that the issue is more nuanced and that they at least believe that they’re fighting to protect children. They may be right or wrong – but in Republicans’ eyes, fighting for children means fighting for traditional family structures, local church social safety nets, strict laws against drugs, abstinence only sex ed classes, emphasizing building responsibility over government assistance, and so on. To them, Democrats’ policies strengthening food stamps, welfare, maternity leave, public education, comprehensive sex ed, public health insurance, and so on either don’t work or even make many problems worse.
So who’s right??

Right now – I’m not interested in arguing who cares ABOUT their kids. Both sides care about their children’s wellbeing. I’m interested in who’s actually caring FOR their kids. Either one side is doing a better job (a statement which both sides agree on!), or both approaches work equally well.
So to move away from our endless hyperbolic rhetoric and detached abstract reasoning I wanted to see what a systematic approach grounded in concrete data actually says on the matter. In the real world, do Rep or Dem states actually have better outcomes for their kids?? More specifically, I took all 50 states and organized them into 5 categories on a scale of more Republican to more Democrat. Since Presidential Elections are the only time that all 50 states are talking about the exact same thing when discussing politics, I measured how states voted over 4 elections. Then, after a decade and a half of voting in one or another way, what was the outcome? Whose kids were actually, factually better off?? As indicators of this, I looked at 1) Childhood Poverty, 2) Infant Mortality, and 3) Teen Pregnancy. Spoiler alert: I’ve ordered these from least to greatest statistical significance.
For more details on methodology, please see my post in the link. For the original data sets and sources used, please see my articles on 1) Economic, 2) Health, and 3) Social Indicators, respectively.
(Note: this isn’t the most robust study. Think of it like a pilot study with some solid, promising results.)
Childhood Poverty
Poverty is a major determinate in decreased physical and emotional health, exposure to crime, access to quality education, and many other quality of life. And no one is more vulnerable to the effects of poverty than young kids and teens who are still physically and emotionally developing. Republicans and Democrats alike all want their children to grow up with basic necessities. But who political party actually does a better job with this goal?
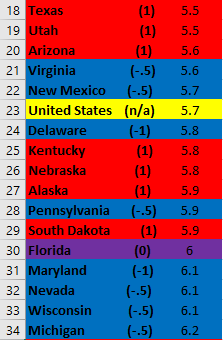
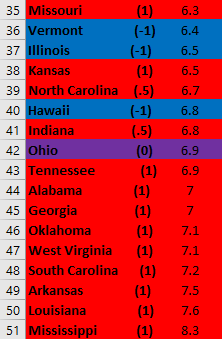
Using US Census data, below are how states ranked.
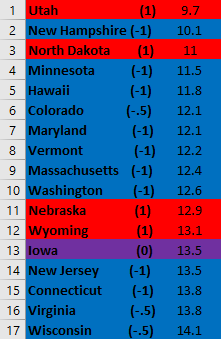

Just eye balling this data, most people I’ve spoken to can see a noticeable disparity – Republican voting states seem to have a lot more poor children than Democrat states. (Note: everything in this study is per capita or percent of population.) However, 1) there are a few notable outliers (more on that later!). 2) this data doesn’t show the magnitude of difference between states, just ranked order. And 3) with anything social, there are tons of different determinants or causal factors that also play a role and aren’t (yet) factored in. So, more statistical analysis is necessary to see if there is a statistically significant relationship between state partisanship and child poverty.
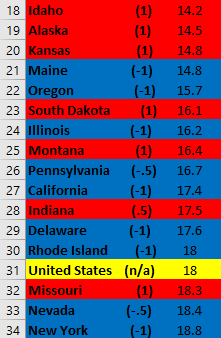
Alas, an R^2 value of .188 is something, but not really that notable. Put simply, Partisanship predicts 18.8% of the variance we see regarding different states’ Child Poverty rates. If this was an engineering or physical science study, we’d need at least a .7 or higher. In social science, since there are always tons of different determinants factoring involved, we want at least a .4, but some journals will publish with a .3 plus. In other words, to be statistically significant means that X predicts at very least 30%, preferably 40+% of the variance in Y.
Still if you believe that partisan values, culture, policies, etc have an effect on these outcomes, which basically everyone does, then now we know the direction and size of Partisanship’s effect, at least defined this way and when not factoring in everything else that also has an effect.
So, what this data does show is that Republican ideology, broadly defined and all things considered, is definitely not better than what Democrats offer. It’s often far worse and at best it’s just as good. Conversely, without factoring in other variables, this data does not definitively demonstrate that Democrats are better since a significant enough portion of Republican states do just as well.
However! You may notice I keep saying things like “all things considered” and that there are other social determinants I’m not factoring in. When doing a Multiple Factor Analysis (MFA) and bringing in other variables, it may still turn out that Partisanship does have a strong statistically significant effect on Childhood Poverty. If you want to continue the story on this particular issue, please scroll down to the data on my Red Oil Hypothesis.
Infant Mortality
This one is probably the most important, or most closely related, to the abortion debate. Pro-Life advocates often say abortion is murder. So if it turns out that states can do something about Infant Mortality and don’t, then that’s arguably Child Abuse and Negligent Manslaughter.
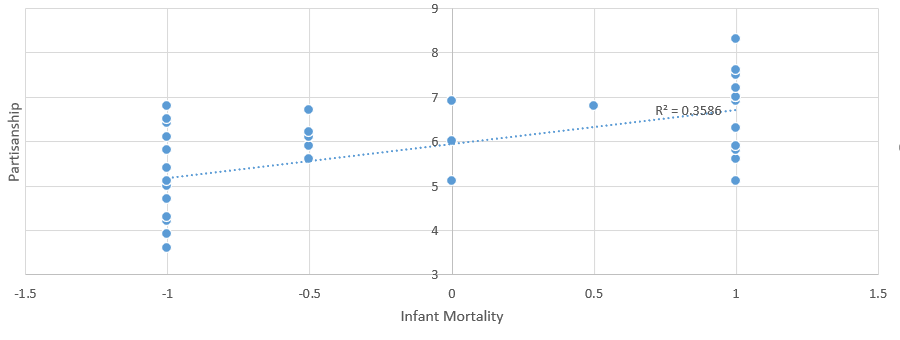
Using CDC data, below are how states rank.
Again, on face value we can clearly see there is some kind of trend. Almost half of Dem states are better than all Rep states, and nearly half of Rep states are worse than all Dem states. Something definitely seems to be going on. But how statistically significant is Partisanship on Infant Mortality (sans-MFA)?

An R^2 value of .2633 is much better! Right off the bat, without factoring in any other determinants, we have a nearly statistically significant result. Partisanship explains over a quarter of the variance we see in Infant Mortality between states.
But wait a second, why am I interested if it is “nearly” significant. Doesn’t that mean that we know it isn’t significant? Well, no, not at all. Considering how complex social issues like infant mortality are, i.e. that many social determinants have some kind of relationship going on, this data suggests that there’s very likely a connection. Specifically, Dem policies likely might play a positive role and/or that Republican policies might play a negative one. Mostly we can say with pretty good confidence that Republican ideology does not play a strong positive role. But again, a Multiple Factor Analysis would be necessary to establish this.
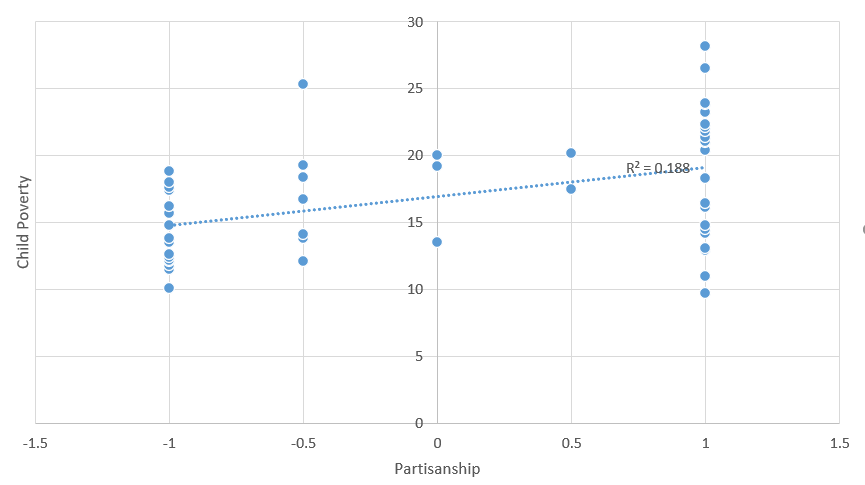
Teen Birth Rate
While Childhood Poverty and Infant Mortality are both more directly about young children’s wellbeing, this last issue is always about two children’s well being. By definition, one child is being born to another child, an arrangement that’s good for neither of them.
Teen Birth Rate is also closely related to the abortion debate itself. While Republicans and Democrats both agree that teen pregnancy is a tragedy to be avoided, if possible, most pro-life Republicans will say that it’s an acceptable alternative to abortion. However, this doesn’t mean that most Republicans would off the bat agree that Dem states do better on this outcome. Republicans argue that parts of conservative policies and culture, like traditional family structures, Christian morality, abstinence only education, and so on are better than liberal alternatives. So, when looking at the package deal, let’s see who’s right?
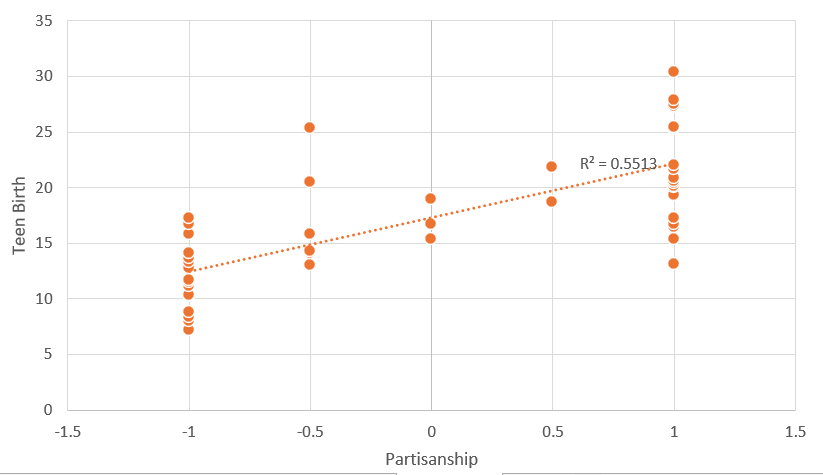
Using CDC Data, below are how states rank.
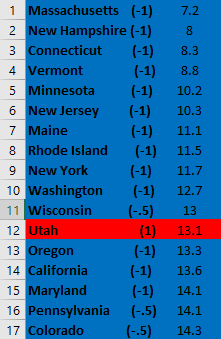

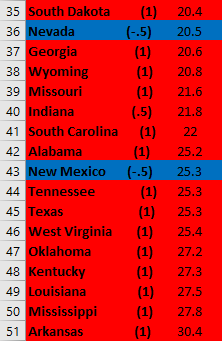
Even a quick glance can show this is the strongest relationship yet. There is only one Rep state in the top third, and only two Dem states in the bottom third. In fact, there are only a few Rep states who are even above the US average. However! What’s the actual statistical relationship between these two variables?

An R^2 value of .5513 is statistically significant. In fact, when running my data on Excel, it automatically changed the color (blue to orange) for me and flagged it as “highly correlated.” So we can with decent confidence say not only that Republican ideology isn’t better at preventing teen pregnancy, but that Democrat ideology likely is. You may be asking, but which specific policies are driving this relationship? Is this because of abortion or sex ed or family values or whatever else? Well unfortunately, that’s a question for another study. Mine just looks at the “package deal.”
The Red Oil Hypothesis
Looking over this and other data from my original study of Reps vs Dems on 23 Quality of Life Indicators, I noticed that most of the Red state outliers were consistently oil states. Right off the bat, this is a very plausible determinant that may be clouding how much partisanship affects these outcomes.
- I don’t think I need to explain that it’s well established that wealthy communities perform better on these metrics. GDP, income, or however you measure it is an enormously powerful determinant for these social and health outcomes.
- I also don’t think I need to explain that Oil = Money. Relatively little infrastructure or human capital is needed to, in a sense, pump dollar bills out of the ground.
- Further, this wealth isn’t tied to a state’s policy. They just lucked into it. Republicans and Democrats talk all the time about this or that approach to improving their economy or attracting businesses and investors. In contrast, oil, like other natural resources, is just there. It can’t move to another state because it doesn’t like a certain policy or has better incentives somewhere else. It’s of course more nuanced than this, but overall there’s a big difference between natural resources like oil and other sectors of the economy.
- In sum, oil states get free money, irrespective of their partisan policies or culture, to tackle the issues I’m discussing.
For more on this reasoning, and the well documented negative effects it often has, please check out the ton of data out there on the Resource Curse.
Now if this was a ‘real study’, instead of a pilot, I’d break out some fancy Multiple Factor Analysis program and add data for oil per capita. Alas I don’t have the time and I’m only quickly crunching these numbers on Excel. So to quickly factor in the effect of this variable, and to test my Red Oil Hypothesis, I merely knocked out the top five oil per capita states and saw if that had any effect on the R^2 value. I then repeated this with the next 6 states (six because of a tie for 10th place). I’d like to run this with natural gas too, but again, it’ll have to wait for if and when I have more time.

Note: the percentage is how much of 1,000 barrels of oil each resident gets a year. So North Dakota pumps 558 barrels of oil for each man, woman, and child. At say $70 a barrel, that’s almost $40k per person per year. The oil & gas industry employs about 15% of the entire workforce in ND. On the low end of the spectrum, for Utah “The energy industry’s total economic impacts in Utah in 2017 included 76,425 jobs [~5% of the workforce]… and $9.4 billion in state GDP — approximately… 6% of the state’s total GDP”. This is a lot, but does it really affect the data if we account for it?
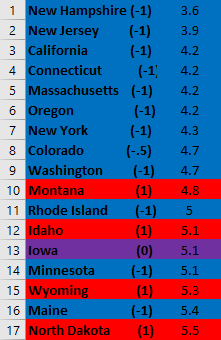
Child Poverty – Red Oil
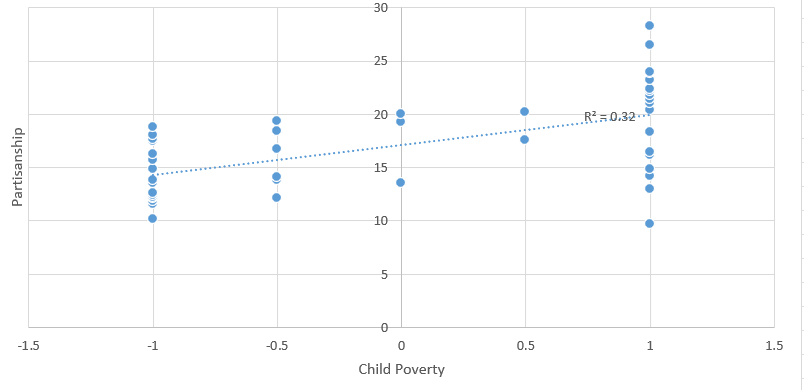
Below is the initial data for Child Poverty without factoring in anything else, such as oil per capita.
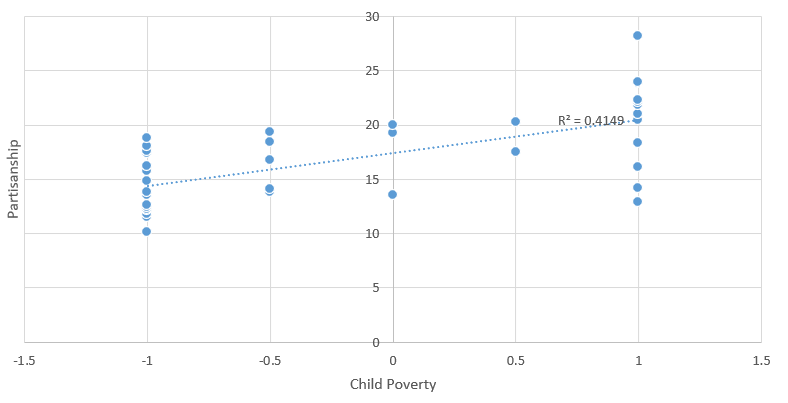
And here are the stats when I knock out 1) the top 5 oil per capita states. We immediately see a 70% rise in the R^2 value, reaching the lowest bar for statistical significance.
And then here’s 2) knocking out the next 6 oil states. Again we see a big rise, about 30%, in the R^2 value, reaching the “better” low bar for statistical significance.
Disclaimer: this isn’t a rigorous Multiple Factor Analysis (maybe later with the time and software), but this method works in a pinch. Think of it like a pilot study. We have a question we’re unsure of so we start looking into it. Immediately we get some data that looks to be pointing in a specific direction. But to really confirm it, we need a clearer look.
So what can we say from this initial research? Well, if my Red Oil Hypothesis was wrong and high oil per capita didn’t affect child poverty separate from the way partisanship apparently affects it, then knocking them out wouldn’t much affect the R^2 value. Instead, making this change had a noticeable effect. So, more specifically, it appears that 1) if you don’t have oil, then partisanship is a sizable factor explaining over 40% of the variance we see and 2) a lot of the Republican states that run counter to the overall trend, ie outliers, might do better on child poverty not because of their ideology, but because of luckily having oil (and the econ boon it brings).
Infant Mortality – Red Oil
In contrast to Child Poverty, Infant Mortality starts off with a lot stronger trend, but gets to around the same statistical significance once we factor in oil rich states. In other words, it seems that having a lot of oil has a separate and significant affect on this outcome, but doesn’t play as big of a role.
Below is the initial data for Infant Mortality without factoring in anything else, such as oil per capita.
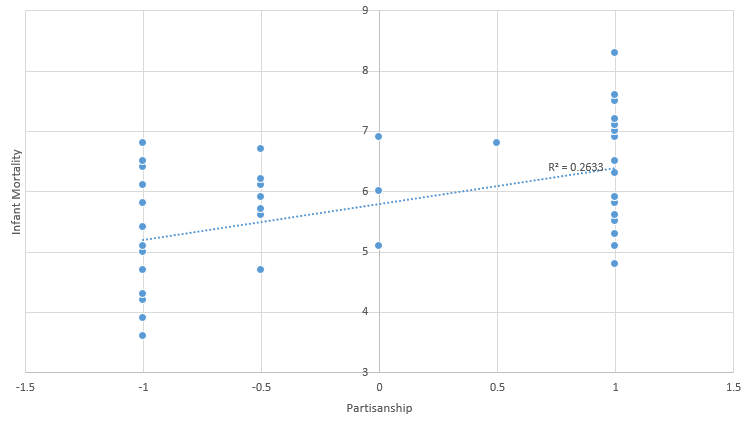
And here are the stats when I knock out 1) the top 5 oil per capita states. The rise isn’t as steep, only about 23%, but interestingly it gets to the same .32 R^2 value.
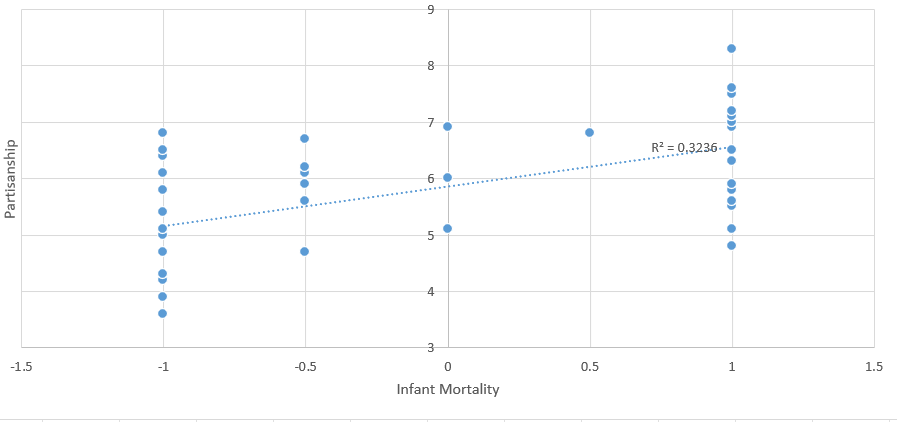
And then here’s 2) knocking out the next 6 oil states. Very little difference is made at all.
All in all we get a pretty similar result. About a third of the variance for non-oil rich states is explained by partisanship. And while we don’t yet have the most definitive argument, we do have a good data driven reason to strongly suspect that Democrats’ package deal works better than the Republican alternative. At very least that the Republican alternative isn’t better.
Teen Birth Rate – Red Oil
Lastly, let’s look at the strongest relationship. Already Partisanship seems to have a big impact on Teen Birth Rates. But does it also get even stronger when we factor in oil rich states? or do they not have much of an additional, separate impact?
Below is the initial data for Teen Births without factoring in anything else, such as oil per capita.
And here are the stats when I knock out 1) the top 5 oil per capita states. Once again, we to see a noticeable shift along the same lines as with Child Poverty and Infant Mortality. There is clearly a pattern. And while percentage-wise, it’s smaller, but absolute value-wise, it’s about the same size of .06 R^2
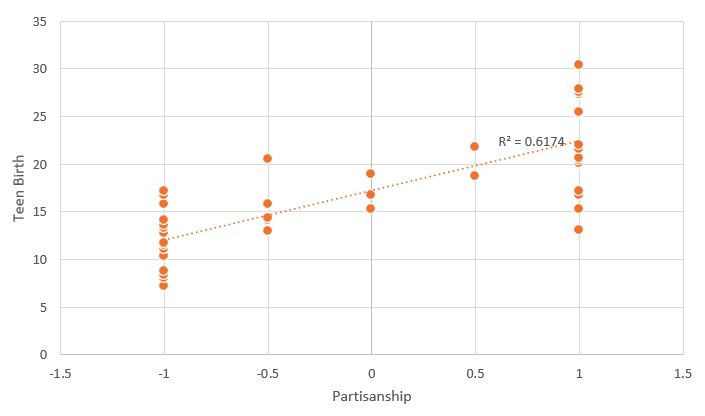
And then here’s 2) knocking out the next 6 oil states. Again, we notice another small but noticeable shift in the same direction.

The same as with Child Poverty and Infant Mortality, it seems that oil producing states are outliers who are doing better because of oil independent of their socio-political values. When we look at non-oil producing states, partisanship explains a whopping 67.6% of the variance. It therefore seems credible to believe that Democrats’ package deal is much better than Republicans. Or at least, it’s willful ignorance to try to argue that we should listen to Republicans’ if we want to avoid the agreed upon horrible outcome of children raising children.
Conclusion
To answer the initial question of this study, Democrats seem to be taking better care of their children than Republicans. To put it bluntly – Dem’s have (per capita) fewer poor kids, fewer dead babies and fewer children raised by children.
Further, many Republican states that seem to be doing as well as Democrats appear to benefit not from their ideology, but from the luck of having oil.
Disagree?
Throughout this article I’ve tried to offer cautious presentation of these results. And similarly, I’ve repeated tat to be really confident about this conclusion, we need a more rigorous study.
But that being said, unless you actually have said rigorous study, it’s irrational to believe otherwise.
“But my personal experience or X anecdote says otherwise!” So what. Your random personal experience or anecdote doesn’t stack up to a systematic comparison of, in a sense, all personal experiences and anecdotes. The reason we have such studies and statistics is because these alternatives are all over the map and easily biased. Why focus on your random experience and not this other completely different random one over there? Instead, systematic studies are how we figure out which anecdotes are outliers and what the actual trend is.
“But other factors might explain away Dem states apparent lead!” Well of course. But again, unless you have the actual data, you have no reason to believe this is the case. If you have an idea like my Red Oil Hypothesis, then let me know! I may be able to get to it and run the numbers. But otherwise, crunch the numbers yourself if you suspect something.
However tempting it may be to do otherwise, we must try our best to look beyond our personal experience and ground our beliefs in data.
