In comparing the quality of life between Red vs Blue states, I’ll be grouping all 23 indicators into 4 main categories:
- 4 Crimes Indicators,
- 4 Social Indicators,
- 7 Health Indicators
- 8 Economic Indicators.
- Plus the Research Methodology
- And the Summary of All 23 Indicators
Intro Comments
As with every other indicator in this study, all of the data collected comes from official government sources and not potentially liberal universities, think tanks, etc. Specifically, the Bureau of Econ Analysis at the Dep of Commerce (GDP per Capita), the US Census (Median Income, HS Graduation, College Graduation), the Bureau of Labor Statistics at the Dep of Labor (Unemployment), the Dep of Agriculture (All Poverty, Child Poverty), and the US Interagency Council on Homelessness (Homelessness). All data sets are the most recent I could find, and from 2018 or 2019, except for the two graduation rates (2017).
If you have any questions about purchasing power parity, what year $$’s are bench-marked at, real vs nominal figures, etc etc, then please check out the respective data sets linked to in this Excel document on Economic Indicators. Since this is just a personal side project I’m doing for fun, I decided to defer to whatever that gov agency decided was the best to collect and present that stat when comparing states.
One interesting indicator that was ultimately rejected was 1) a State Gov’s Federal Dependency, ie funding per capita a state receives from the national government. In some recent debates, states that take the most money are, in a twist of the common phrase, “welfare states.” However, I couldn’t find direct gov stats, only third party studies (which themselves used such stats). Similarly, I couldn’t find anything about per capita welfare program participation, except for 2) Food Stamps. I rejected using this since I didn’t want to be seen as cherry picking this particular program. Both Indicators are analyzed in the Controversial Indicators post (not yet up).
TL ; DR!
Note: A political party can do “vastly,” “clearly,” or “slightly” better.
GDP per Capita – Democrats do Vastly Better
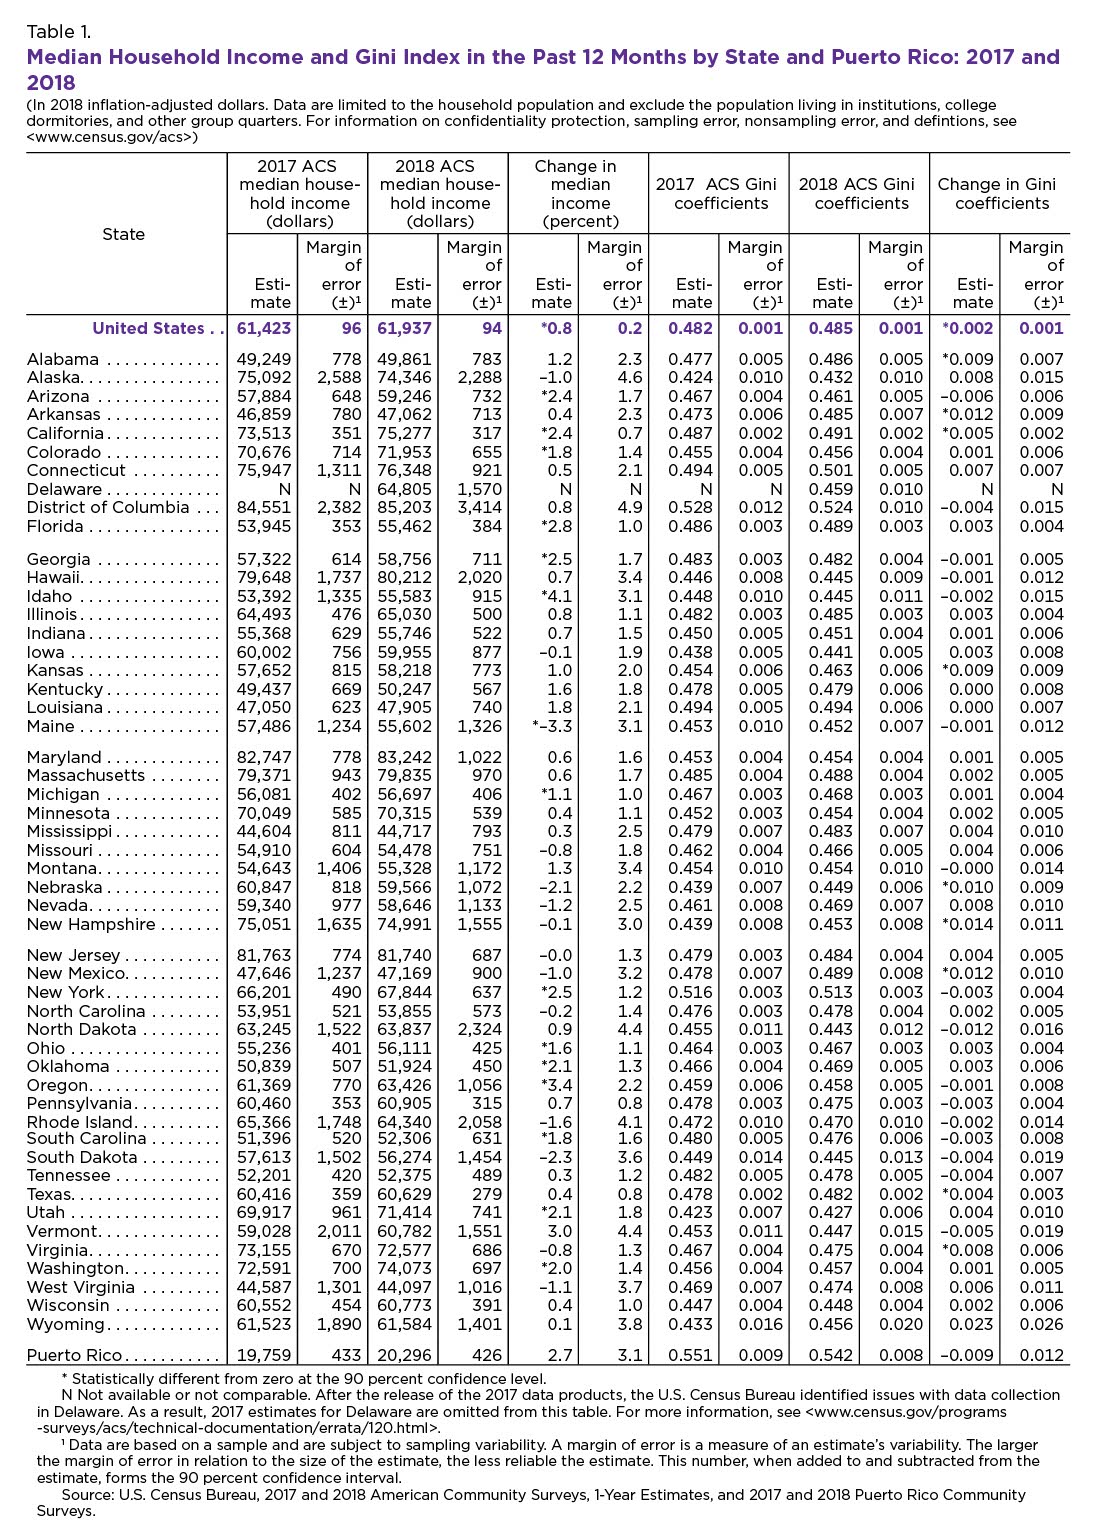
Median Household Income – Democrats do Vastly Better
Unemployment – Democrats do Slightly Better
All People in Poverty – Democrats do Vastly Better
Child Poverty – Democrats do Vastly Better
Pop Graduated HS – Democrats do Slightly Better
Pop Graduated College – Democrats do Vastly Better
Homelessness – Republicans do Vastly Better
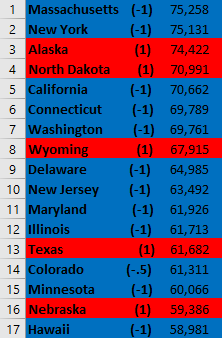
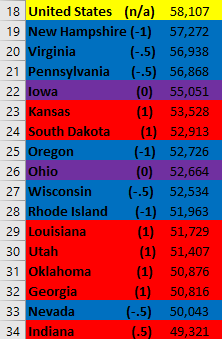
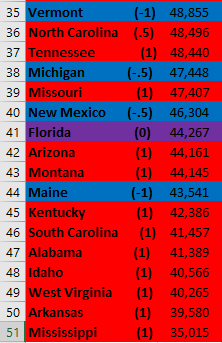
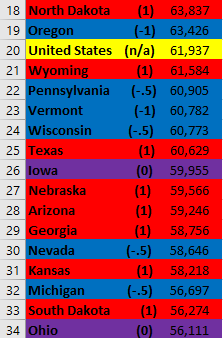
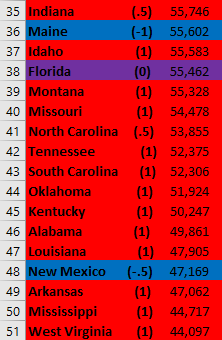
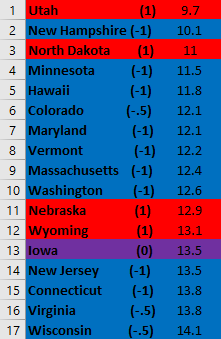
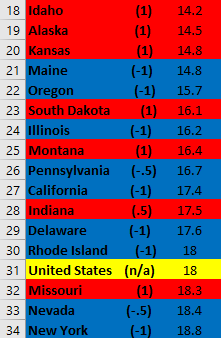
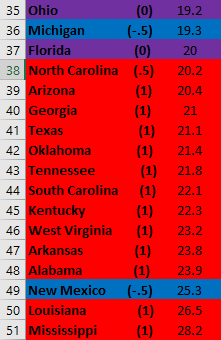
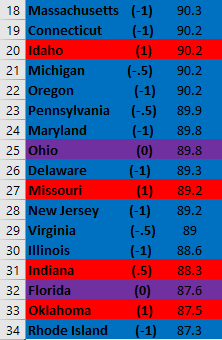
GDP per Capita
In this oft touted economic metric, Democrats do vastly better than Republicans in 2019, winning each category and almost all with major wins.
The purpose of this study isn’t to get into causal pathways, but I’ll nonetheless be sharing my own personal ideas on such and speculate on patterns. Feel free to do the same in the comments!
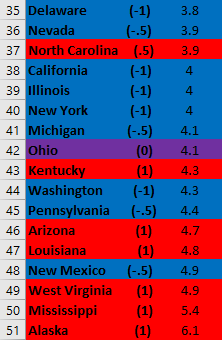
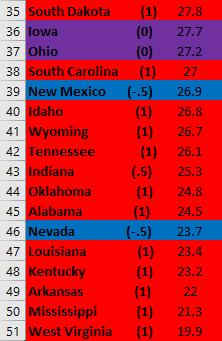
The first things that caught my eye was oil – every Red states in the good basket (top 15) is a major producer of oil and natural gas. Texas and North Dakota are the top producers of oil in the US by a huge margin. Alaska and Wyoming are 6th and 8th, respectively. If all of the wealthy Red states are wealthy because of oil, it makes me wonder how the inevitable switch to renewable energy will affect American politics. Additionally, I wonder how much the resource curse has already impacted these “Banana Republics.”
I’d also like to note that Dems are split almost 50-50 above and below the US average. However, this changes dramatically when you account for how Blue a state is. (1) means they voted Blue or Red in all 4 past elections, while (.5) means they “defected” once. There’s only one (.5) Blue state above the average (and it’s close to it). In sharp contrast, 55% of Blue states below the average are (.5)’s.
*Note: This level of partisanship isn’t formally accounted for in my data analysis. However, if anyone has the time, it’d be great to run those numbers!
All in all, it seems the more Blue, the better you do! Unless, of course, you have oil.
Model & Failed States – Top & Bottom 5
60% are the Model States are Blue, making Democrats only the minor winner for this metric.
However, 100% of Failed States are Red, making Democrats the major winner.
The Good & Bad Baskets – Top & Bottom 15
73% of the Good Basket, are Blue, making Democrats the major winner.
Similarly, 73% of the Bad Basket are Red, again giving Democrats a major win.
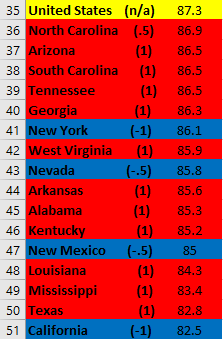
States Making America Great – Percent Above US Average
Last, but not least, 52% of Blue States and 21% of Red States are Making America Great. So Democrats are the major winner here by a hair.
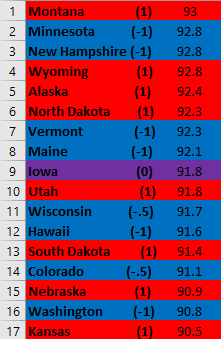
Median Household Income
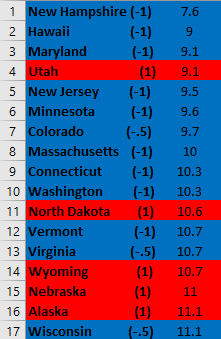
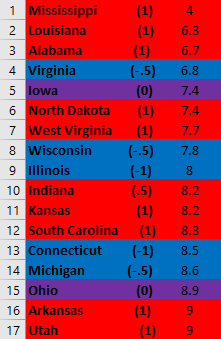
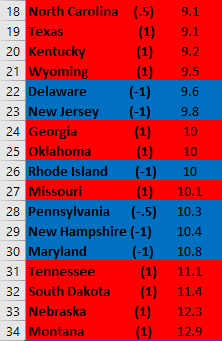
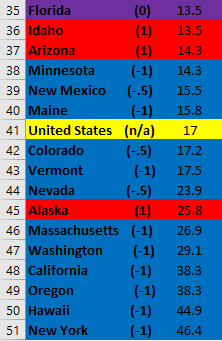
Again, as with almost all of the economic indicators, Blue states have an absolutely decisive victory over Red states in 2018 – with major wins in all 5 metrics! I should have added a “devastatingly better” title for indicators.
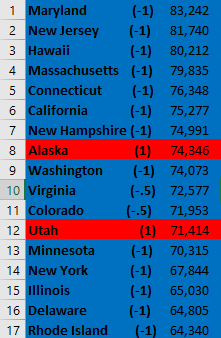
First, I’d like to point out that, again, it looks like oil is responsible for the Red state outliers who’re above the US average. Alaska and North Dakota were already noted, but Utah fits the mold since it earned 10th place in oil production in the source I link to above.
Second, the same pattern of Blue partisanship holds true again, but this time in sharper contrast. Now 71% of the Blue states that’re below the US average are (.5)’s. Similarly, the first seven states are all (1), ie true Blue Democrats!
Personally, I also think Median Income is much more important than GDP per Capita since it looks at where regular Americans are at and isn’t skewed dramatically by billionaire outliers.
Again, it appears the middle class is sustained by liberal policies. Unless, of course, you have oil.
Model & Failed States – Top & Bottom 5
100% of the Model States are Blue, making Democrat the major winner.
And 80% of Failed States are Red, again making Democrats the major winner.
The Good & Bad Baskets – Top & Bottom 15
87% of the Good Basket are Blue, making Democrats a third major win.
Similarly, 87% of the Bad Basket are Red, giving Democrats yet another major win.
States Making America Great – Percent Above US Average
Last, but not least, 70% of Blue States and a mere 13% of Red States are Making America Great. So Democrats are the major winner here by an enormous margin.
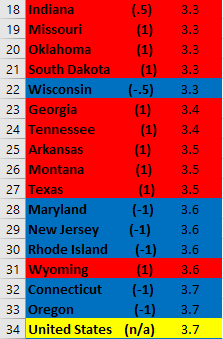
Labor Force Unemployed
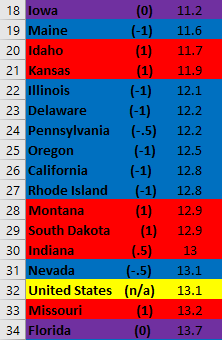
Democrats definitely won this indicator, carrying 3 of 5 metrics, including the only major win, over Republicans in 2019. And while the liberal in me is content with the results, the researcher in me wishes the quality of the data and some technical aspects of its analysis were better.
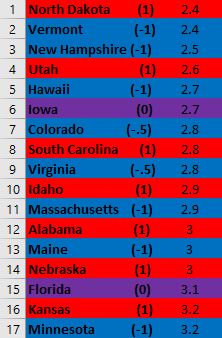
First, some points about analysis. Namely, there isn’t much difference or variation in the numbers as I’d like, resulting in a lot of ties. So, for instance, I had to take the top 6 and bottom 16 states. This, combined with the fact that Purple states count as zero (see the Methodology post), made for some weird results for both “Basket” metrics.
Second, it looks like this metric would benefit a lot from elucidating partisanship a bit more. For instance, the first “solid Blue state” with a (1) is 8th from the bottom. Additionally, a very close majority of Red and Blue states are above the US average.
Third, I’d like to point out that my Red Oil Theory continues to hold since North Dakota and Utah are leading Red states.
Fourth, there’s no Welfare Indicator (except in the Controversial Indicators post (to come)) in this study, but with how much conservatives talk up welfare as being horrible because it incentivizes unemployment, this indicator at least comments on the debate. To start, no one really disagrees with this claim. Welfare obviously lowers employment incentives. But this doesn’t yet tell the full story. After all, seat belts lower incentives to drive safely.
The real question is, “how much?” And the answer, which this indicator proves, is “not nearly enough to warrant conservative panic.” Even if welfare lowers employment incentives, a roaring economy (see first two indicators) more than makes up for it. Additionally, Dem’s believe welfare reduces poverty, which is addressed in the next metric.
Data Set 1
Model & Failed States – Top & Bottom 5
60% of the Model States are Blue this time, making Democrats the minor winner.
80% of Failed States are Red, again making Democrats the major winner.
The Good & Bad Baskets – Top & Bottom 15
47% of the Good Basket are Blue, making Democrats the minor winner here.
Also, 50% of the Bad Basket are Blue, giving Republicans their minor win.
States Making America Great – Percent Above US Average
Lastly, 61% of Blue States and 71% of Red States are Making America Great. So Republicans are the minor winner here.
All People in Poverty
Like Median Income above, Democrats won another “crushing” victory over Republicans in 2018 since all five metrics were major wins.
Once again, my Red Oil Theory holds. All of the leading Red states, except for Nebraska, are top 10 oil producers.
In addition, it seems that welfare is doing the job predicted by Democrats and staving off poverty. Despite there being pretty similar amounts of unemployed people in both Red and Blue states, percentage-wise, Blue states do an excessively better job making sure those unemployed people aren’t in poverty. Yes, this means a few grifters won’t reap the fruits of their laziness. But that’s a bullet I’m personally more than willing to take to make sure a family down on their luck can eat.
Data Set 1
Model & Failed States – Top & Bottom 5
80% of the Model States are Blue, making Democrat the major winner.
And 80% of Failed States are Red, similarly making Democrats the major winner.
The Good & Bad Baskets – Top & Bottom 15
73% of the Good Basket are Blue, giving Democrats another major win.
And 87% of the Bad Basket are Red, giving Democrats yet another major win.
States Making America Great – Percent Above US Average
87% of Blue States and 42% of Red States are Making America Great. So Democrats are the major winner here, with an enormous percent above average.
Child Poverty
Similar to percent of all people in poverty above, Democrats have almost all majors wins across all 5 metrics compared to Republicans for 2018.
Thank you Jesus (it appears) that the oil rich Red states of Utah and North Dakota have used their money to bail children out of poverty. However, Blue states, again, completely dominate this indicator.
This is the first of six child centered or related indicators. I speak about all of them together and relate them to the abortion debate in the up coming Summary of All 23 Indicators post. But briefly, if you care about abortion so much that it’s what you focus on when casting your ballot, then you should care about child poverty. And on this, Democrats do a vastly better job.
Data Set 1
Model & Failed States – Top & Bottom 5
60% of the Model States are Blue, making Democrat only the minor winner.
And 80% of Failed States are Red, providing Democrats a major winner.
The Good & Bad Baskets – Top & Bottom 15
67% of the Good Basket are Blue, giving Democrats another major win.
And 87% of the Bad Basket are Red, giving Democrats a third another major win.
States Making America Great – Percent Above US Average
Finally, 83% of Blue States and 42% of Red States are Making America Great. So Democrats are the major winner here.
High School Graduation
Like Unemployment, Democrats only do a bit better than Republicans on this metric in 2017. Republicans have a win and a tie, but Democrats still pull three wins, two of them major.
I’d like to start by making it clear why education is included under economics: human capital theory. Some conservatives complain about education as if it’s part of some liberal agenda, but the truth is that its just Econ 101 straightforward required for a flourishing economy. It’s also, of course, intrinsically valuable for a flourishing mind, arts, and civil society. But I included it here to emphasize, in true conservative American fashion, it’s economy utility.
Notably, the Good Basket here is the first and only tie I recorded across all indicators, a result of Purple states counting for 0, ie neither side. I’d interpret this plus the other metrics as, “It’s unclear whether Red or Blue states do HS better, but it’s clear who does it worse.”
Also, my Red Oil Theory is still certainly present, but not as strong. Besides Montana at first, the next four Red states (much of the Good Basket, btw) are all oil states.
I’d also like to note that out of all 23 indicators, this is where there is the most “socialist” agreement across all 50 states. Every single state has guaranteed every student, regardless of ability to pay, schooling through high school. It’d be interesting to see how states compare when this guarantee is removed.
Model & Failed States – Top & Bottom 5
60% of the Model States are Red, making Republicans the minor winner.
And 60% of Failed States are Red, providing Democrats a minor winner.
The Good & Bad Baskets – Top & Bottom 15
50% of the Good Basket are Red & Blue, making this a tie.
And 73% of the Bad Basket are Red, giving Democrats the first major win.
States Making America Great – Percent Above US Average
Finally, 83% of Blue States and 50% of Red States are Making America Great. Providing Democrats a second major win.
College Graduation
With % of the population graduating college we’re back to a crystal clear win for Democrats over Republicans in 2017.
First, this win is all the more stark when additional “hues” are taken into account. The bottom five Blue states are all (.5) states and Maine is the only “true blue” Democrat state, ie (1), to fall under the US average.
Second, a limitation of this indicator is that it does not include trade jobs. I’d love to have included some kind of indicator on average salary for a trade job or graduates from trade schools, but didn’t easily find anything. I need to look more into this, and if I ever find something will have to add it.
Nonetheless, despite all of the complaints about college, especially skyrocketing costs (see guaranteed public option I mention for HS), it’s still the case that a college degree will add 50 to 100% more, on average, to your lifetime income compared to only a HS diploma, and this earning gap is continuing to get wider. They’re expensive, but remain well worth the price tag.
Model & Failed States – Top & Bottom 5
60% of the Model States are Blue, making Democrat only the minor winner.
And 80% of Failed States are Red, providing Democrats a major winner.
The Good & Bad Baskets – Top & Bottom 15
67% of the Good Basket are Blue, giving Democrats another major win.
And 87% of the Bad Basket are Red, giving Democrats a third another major win.
States Making America Great – Percent Above US Average
Finally, 83% of Blue States and 42% of Red States are Making America Great. So Democrats are the major winner here.
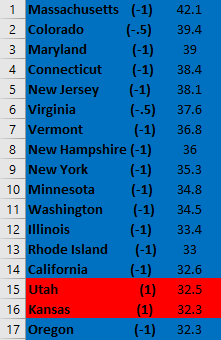
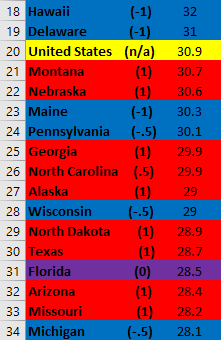
Homelessness
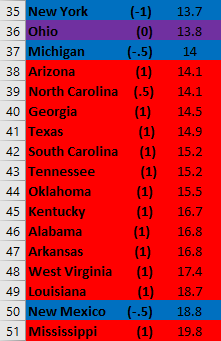
Here we finally have a solid win for Republicans over Democrats in 2019, taking all 5 metric including two major wins!
First, this win is even more impressive if you account for more nuance political affiliation since 60% of the top 5 Blue States are (.5)’s and there’s only one Red state below the US average. Additionally, only one Red state is below the US Average. Democrat states clearly have a massive homelessness problem!
Second, we can muse over the causes, but I think both conservatives and liberals roughly agree that higher houses costs in Blue states and lower pop density and more land in Red states plays a big role. Like unemployment, it’s also likely that Republicans are right that welfare lowers incentives to rise out of poverty, including homelessness.
Third, I’d like to mention a well tested and proven liberal leaning “welfare type” of solution that even Blue states aren’t doing – just give the homeless free homes. It’s consistently worked in foreign countries and domestic states, and is cheaper than approaching the problem with policing and shelters. You can read here how it reduced homelessness in Utah by 90%. And then once the program was stopped, homelessness doubled.
Model & Failed States – Top & Bottom 5
60% of the Model States are Red this time, making Republicans the minor winner.
100% of Failed States are Blue, again making Republicans the major winner.
The Good & Bad Baskets – Top & Bottom 15
53% of the Good Basket are Red, making Republicans the minor winner here.
Also, 80% of the Bad Basket are Blue, giving Republicans a major win.
States Making America Great – Percent Above US Average
Lastly, 61% of Blue States and 96% of Red States are Making America Great. So Republicans are the minor winner here.
Conclusion
I’ve already spoken about quite a few different topics. But to recap and add a bit:
Blue states clearly do better than Red states on Economic Indicators, except for homelessness. And to bolster this point, it appears like there’s decent evidence that most Red outliers that are doing well, economically-speaking, are doing well because of oil.
Whether this overall economic success is caused by Blue policies and culture or vice versa is hard to say. However, in so far as you think political policies and culture affect economic outcomes, 12 years of voting Democrat hasn’t severely hurt Blue states’ current economic outlook, and voting Conservative hasn’t done wonders for Red states.

Pingback: Research Methodology — Are Red or Blue States Better? | Applied Sentience·
Pingback: 7 Health Indicators – Are Red or Blue States Better? | Applied Sentience·
Pingback: Summary of 23 Quality of Life Indicators — Are Red or Blue States Better? | Applied Sentience·
Than why do we see the mass movement of people relocating from CA and NY to TX and FL, but not the other way around?
LikeLiked by 2 people
Good thing to look in to! Economists and sociologists usually look into both pull and push factors for why ppl move. And these factors vary for diff demographics! So first ask who’s moving and then ask those ppl why.
The leading explanation is that relatively wealthy individuals are moving bc of housing costs. Housing costs are higher in CA, NY bc everyone wants to live there. Ppl have been moving into those states for a long time and now they’ve past a supply and demand threshold. Tx, Fl are a lot poorer and have much lower housing costs in their cities. So these middle and upper class CA, NY indv’s can get more bang for their buck there.
However, most ppl who can afford to move (which is always expensive) in Tx, Fl are still too poor to get comparable places in Ca, Ny.
LikeLike
“Mass” movement is a subject of debate to. TX and FL also have high Hispanic populations who have had (and continue to have) high birth rates. Without internal growth, the population growth in Texas would slow down. Also, housing and other costs seem to be increasing in Texas faster than general inflation (which has been high recently) to the point the cost advantage may be withering away a little.
As a Minnesotan living in Texas (and planning to move back), I see a massive difference in general/per capita human development between the DFW and MSP regions. There are relatively good and bad pockets in both regions but I’m referring to average/typical. Health, education, civic engagement/community engagement, etc…the regions do have vast historical and demographic differences that make the affects of policy decisions debatable but data sources do support my contention that human development is way higher than Minnesota. Also, Texas is a “relatively” prosperous state in a fairly backwards region (the West South Central as a cluster is arguably the worst place in the country outside of isolates like Mississippi and West Virginia). Minnesota’s neighbors, even if not blue all of the time, are bluer than Texas’ neighbors. Like Iowa actually has some things going for it. Arkansas may have some natural beauty but aside from that, it doesn’t.
LikeLike
Florida and Texas have zero income tax. CA and NY have high living costs and taxes. Once you made your money you retire to cheaper place to live.
LikeLike
Fascinating. its the blue municipalities and states that have failing pension systems, not red ones. its the red states where all the blue citizens are moving to–after they have destroyed the place they live by voting blue. such hypocrisy of the democrat failures.
LikeLike
Sure there are ways that Red states are better (although you provide no evidence of this). This study found 3 of them. But the above facts are still facts.
LikeLike
Red state-minded people move to red states when they retire. Just because you live in a blue state doesn’t mean you are a democrat. And yeah, blue states have more public workers because blue states provide more services for their citizens, so this means more pensions; however, the problem, at least in CT, with pensions goes back decades when states offered pensions with little actuarial science applied to them. When you dig into an issue, you find that the sound bite talking point is woefully inadequate in explaining what’s really going on.
LikeLike
You can pick the winners by what you evaluate. Better to look at WHY blue state pay is higher–because it has to be for people to live and work there. Some other measures? Crime rates, Cost of Living, Tax rates and so forth. Interesting selection of what you judge–it’s as if you had your answer and measured those that would get you there.
LikeLike
Hi Mike, I do cover lots of various indicators, almost 2 dozen in fact. And that includes “crime rates”, which you mention. You can also read the Methodology Section about why and how I chose the list of indicators I did. I can assure you I did not look at any of the data before making my selection of indicators.
LikeLike
I would like to challenge conventional methods for income. Is the cost of living differences adequately reflected? I read this all the time…richest blue states have highest homelessness. And what about the REALITY of the lives of the working poor? From personal experience, kansas fares much better than washington when it comes to people’s actual lives.
Is it possible that traditional methods are not accurate and that is why blue states consistently perform better than red ones? Could the fact that red states clearly do better on homelessness be evidence that there’s something wrong with how we gather and analyze data in this category?
I 10000% (not a typo…lol) agree with you about housing first! Seems like a no-brainer backed by ample evidence.
LikeLiked by 1 person
Hi Sarah! Thanks for your comment.
Yes, there are issues with income when not looking at cost of living. But stats for incomes and GDP still do, all things consider, track for wealth overall. Especially when you compare within a country. For instance, when living in rural WV, my brother always complained how expensive everything was bc it was so hard to ship things out to these small communities. In suburban Louisiana, I was shocked that a lot things were as expensive as in NYC.
I think a lot of the other indicators in this little study also look at the “reality of the lives of the working poor.” Check out the 15 non-Economic indicators for more. Also, this study looks at the overall stats, since our personal experience can be (and I think often is) very wrong.
For instance, Washington ranks 10th (near the best) for both overall and child poverty, while Kansas does significantly worse at 21st and 20th, respectively. Randomly choosing outside of economics, I found Washington is 10th best and Kansas ranks 33rd for teen birth rate.
Sure Kansas beats Washington in a handful of places. But the overall picture of these stats may be diff than our personal experience.
LikeLike
Pingback: The GOP Has Become the Party of Poverty, Disease, and Death – Smart Again·
Pingback: Everything the GOP Touches Causes Poverty, Disease & Death - LA Progressive·
Pingback: The GOP = Death Cult – Bitch Anarchy·
Pingback: Why Does Everything the GOP Touches Cause Poverty, Disease & Death? - EgbertoWillies.com·
Pingback: The GOP Has Become the Party of Poverty, Disease, and Death – Brewminate: A Bold Blend of News and Ideas·
Pingback: Red Vs Blue States – Who’s Actually Pro-Children? Statistical Analysis of Child Pov, Mortality, & Teen Birth Rates | Applied Sentience·
Pingback: That Was Then, This Is Now – Liming's Links·
Pingback: When Will Americans Again Believe In America? - Daily Kos » Sebuahuta.site·
Salaries can be less in red states due to a lower cost of living. Crime rates can be distorted by the large cities being run by democratics even in red states. The largest democratic state has the lowest high school graduation rate. This study didn’t go deep enough into what their data really meant. Biased at best!
LikeLike
Did you actually look into any of your guesses? Or just grasping at straws?
For instance, please crunch the numbers and factor in cost of living. It still comes out Blue states are wealthier. Not to mention, regardless of local cost of living, most of the US’s collective wealth is made in Blue states. You can also see how Blue states lead on basically every other economic and health indicator, like poverty, food security, and health outcomes.
Not sure how crime in cities makes up for Red states being worse. Murder is murder regardless if its in cities, suburbs or towns. Not to mention, when you look at the the top 10 or 20 worst cities, most are in Red states. Look it up.
And sure, there are outliers, like the HS grad state you mentioned. But if we’re looking to see if there’s an over all pattern we have to look at the whole trend.
LikeLike
If this is true, surely I can find someone in a red state who would swap their house and real estate of equal value for mine in a blue state. I prefer eastern Tennessee.
LikeLike
Of course! Macro trends don’t really entail anything for individual interactions.
LikeLike
Pingback: Corporate Money, Especially from Big Oil, is Controlling the Media and the Narrative: “Government is Corrupt, So Let Us Rule the US” – Stem Cells, Health, Technology·
Total BS. Stats can say whatever you want them to say and do not look at the entire picture. Why are largest failing cities mostly blue, run by blue in those states that are “better”? Most blue states have a few large cities controlling the whole state.
LikeLike
Actually they can’t. I fully described my entire methodology and then collected and crunched the data accordingly. I presented everything I found. It’s all there out in the open. I’d recommend engaging the findings directly instead of having an emotional reaction to it.
As for cities, which is a different unit of analysis than is used in this study, almost all cities are blue, so it says nothing of red vs blue. You’d have to compare red cities to blue cities. Or blue cities to red rural areas. Basically, you need to make a comparison to make a point. I did that by looking at all red states and comparing them to all blue states.
LikeLike
Pingback: Say Buddy Can Ya Lend Me A Dime? and other Tidbits – Arthur Ruger: Curmudgeon at Work·
Pingback: White rural rage: The secret political force shaping America's future - CiviPress.News·
Pingback: Our Leaders Have Failed Us – Ed O’Rourke – edorourke.com·
would love to see a side by side of comparison dates to current conditions!
LikeLike
Pingback: Make Trump 2.0 Irrelevant Again | Populareconomicsblog·
Pingback: Will Corruption Ever End? | Art Salazar·
Pingback: This brutal doctrine explains what Trump’s done to America — and what’s coming next – Feed1·
Pingback: This brutal doctrine explains what Trump’s done to America — and what’s coming next – DNYUZ·