In comparing the quality of life between Red vs Blue states, I’ll be grouping all 23 indicators into 4 main categories:
- 4 Crimes Indicators,
- 4 Social Indicators,
- 7 Health Indicators
- 8 Economic Indicators.
- Plus the Research Methodology
- And the Summary of All 23 Indicators
Intro Comments
As with every other indicator in this study, all of the data collected comes from official government sources and not potentially liberal universities, think tanks, etc. Specifically, the CDC (Life Expectancy, Infant Mortality, STD’s (Chlamydia/Gonorrhea), Obesity, and Hypertension), the US Census (Health Insurance) and Dep of Agriculture (Food Insecurity). All data sets are from 2018, the most recent I could find.
For more details on why I picked certain indicators and data sets and how I calculated everything, check out the Methodology post (link above). In addition, here’s the Excel Doc I used for all of the Health Indicators.
As with all of the other indicators in this study, I chose health indicators based on common ground between liberals and conservatives. The first four are one’s that everyone cares about, with Health Insurance being a particularly hot political topic. Additionally, I’d like to point out that Infant Mortality is too, when you consider the issue of abortion. The last three indicators were chosen because they have significant social components, so political ideology and culture can be said to play a role in the rate of these.
TL ; DR!
Note: A political party can do “vastly,” “clearly,” or “slightly” better.
Life Expectancy – Democrats do Vastly Better
People without Health Insurance – Democrats do Vastly Better
Infant Mortality – Democrats do Vastly Better
Household Food Insecurity – Democrats do Vastly Better
STDs: Chlamydia (Gonorrhea) – Democrats do Clearly (Vastly) Better
Adult Obesity – Democrats do Vastly Better
Hypertension Mortality – Democrats do Vastly Better
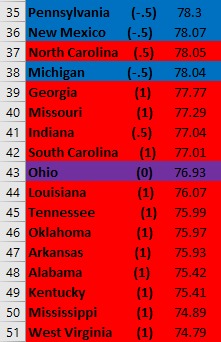
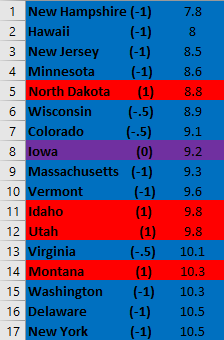
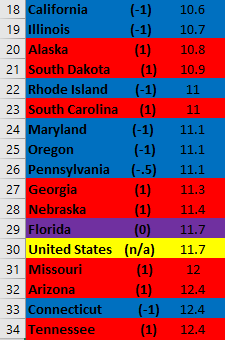
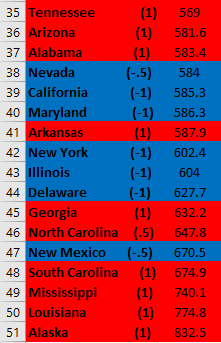
Life Expectancy
In this first Health Indicator, Democrat states do vastly better in 2018 with major wins in all five metrics compared to Republicans.


I’m discussing this indicator first because it’s probably the most basic indicator of a society’s health. Only a small fraction of people die because of murder or accidents, but even in this regard issues like the quality of doctors/hospitals and availability of health insurance play a large role. In this way, the rest of the indicators in this category provide the details for this story – the main arc of which is: Blue states are a lot healthier.
Note: I’d like to point out that the (1) and (.5) next to each state refers to its degree of partisanship. A (1) means they voted Red or Blue in all 4 of the past elections, and (.5) means they “defected” once. Check out the Methodology post for more on this and related such. This info isn’t formally integrated into the score, but I’ll discuss some details that catch my eye. Future studies might factor in this more detailed partisanship measure.
For instance, it’s easy to notice that only 3 of the 17 Blue states above the US average are (.5), but 4 of 6 Blue states below it are. So the Blue-Red partisan correlation is even stronger than my initial analysis shows.
In the post on Economic Indicators, I started writing about what I call the Red Oil Theory after I noticed that Red states who were top 10 US oil producers – namely Texas (1st), North Dakota (2nd), Alaska (6th), Wyoming (8th), and Utah (10th) – often did far better than other Red States. Here the same pattern shows up again, though weaker than in the Econ Indicators, with half of the Red states above the US average being major oil producers. I won’t write about this much for the rest of the health indicators, but it’s something to keep an eye out for.
Model & Failed States – Top & Bottom 5
100% of the Model States are Blue, making Democrat the major winner.
And 100% of Failed States are Red, again making Democrats the major winner.
The Good & Bad Baskets – Top & Bottom 15
73% of the Good Basket are Blue, making Democrats a third major win.
Similarly, 87% of the Bad Basket are Red, giving Democrats yet another major win.
States Making America Great – Percent Above US Average
Last, but not least, 74% of Blue States and a mere 42% of Red States are Making America Great. So Democrats are the major winner here.
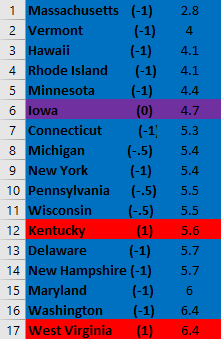
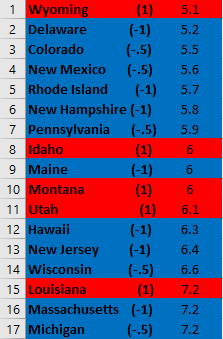
Residents w/o Health Insurance
Democrats again do vastly better than Republicans in 2018 with providing health insurance coverage to a greater percentage of their residents.


In a sense, this is in some ways more of a social or political topic. However, I decided to include it here since it plays an important role in health outcomes and might help elucidate other indicators.
Regardless, it certainly appears that Democrat policies are better at providing residents with much needed health care coverage. Unfortunately, whether more coverage is provided through better employment or welfare isn’t clear. (Although Blue states do better on unemployment, an Econ Indicator I discuss).
It’s also worth noting this trend is also stronger than it first appears. The worst three Blue states are all (.5). Every single solid Blue state (1) is not just above the US average, but among the top 26 states.
Model & Failed States – Top & Bottom 5
100% of the Model States are Blue, making Democrat the major winner.
And 80% of Failed States are Red, again making Democrats the major winner.
The Good & Bad Baskets – Top & Bottom 15
87% of the Good Basket are Blue, providing Democrats a third major win.
Similarly, 87% of the Bad Basket are Red, giving Democrats yet another major win.
States Making America Great – Percent Above US Average
Lastly, 91% of Blue States and 38% of Red States are Making America Great. So Democrats are the major winner.
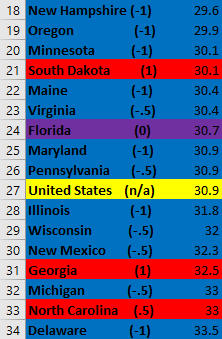
Infant Mortality
Blue states again do quite a lot better on infant mortality in 2018 than Republicans.
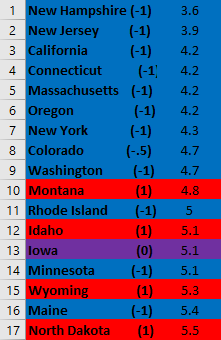

I’d first like to note that, like the others above, looking at more detailed partisanship strengthens this trend. For instance, not only are the top 7 states all solid Blue states, but the bottom 9 states are all solid Red.
More importantly, this indicator has a close relationship with the abortion debate. If a voter’s concern is child welfare, then Red states appear to become much less concerned after the child is born.
However, to “elucidate” this position a bit, Conservatives I’ve spoken with seem to be more concerned with morality than outcomes. It’s acceptable, even better, that each person fends for themselves, even if more people suffer and die as a result. In contrast, what they can’t accept is an overt immoral action, which they believe committing abortion falls under. In this view, killing a fetus is unacceptable, since it’s intentionally done, but letting a child die is merely regrettable, since it’s things just running their course.
If this broader theory is the case, one interesting idea is that this whole study, which looks at outcomes, is flawed because Conservatives don’t actually care about outcomes. They might be totally willing to accept horrible outcomes, even live in a society mired in suffering, as long as their moral views, like fairness or good intentions, are made into laws.
Model & Failed States – Top & Bottom 5
100% of the Model States are Blue, making Democrat the major winner.
And 100% of Failed States are Red, again making Democrats the major winner.
The Good & Bad Baskets – Top & Bottom 15
73% of the Good Basket are Blue, providing Democrats a third major win.
Similarly, 80% of the Bad Basket are Red, giving Democrats yet another major win.
States Making America Great – Percent Above US Average
Lastly, 61% of Blue States and 29% of Red States are Making America Great. So Democrats are the major winner.
Data Sets 1
Household Food Insecurity
Again Democrats do far better than Republicans on the percent of households experiencing food insecurity in 2018, however not as huge of a lead as the indicators discussed above.

I was hoping to find something on malnutrition, especially child malnutrition, and this is the best that I found, from official gov statistics at least.
Like infant mortality, there is an interesting (though weaker) relationship to the abortion debate. If you’re “pro-life” and your heart is bleeding for the welfare of vulnerable children, then you should care about this Indicator more than others.
Model & Failed States – Top & Bottom 5
80% of the Model States are Blue, making Democrat the major winner.
And 80% of Failed States are Red, again making Democrats the major winner.
The Good & Bad Baskets – Top & Bottom 15
67% of the Good Basket are Blue, providing Democrats a third major win.
Similarly, 73% of the Bad Basket are Red, giving Democrats yet another major win.
States Making America Great – Percent Above US Average
Lastly, 78% of Blue States and 38% of Red States are Making America Great. So Democrats are the major winner.
Data Set 1,
STDs – Chlamydia (Gonorrhea)
Democrats do much better on both of these two specific STD’s than Republicans in 2018.
So a little about the confusing way I present this Indicator. I wanted to find a general overall Indicator of STDs (or STIs) but unfortunately couldn’t. However, I did find good data on individual STDs. I didn’t want to just pick one because I might be accused of cherry picking the STD that looked best for Democrats. So I picked the first two that showed up and ran the numbers for both. I’m presenting the one that Republicans do better on (Chlamydia) – again, so I’m not accused of bias. You can check out my data on the other (Gonorrhea) in the Health Indicators Excel Doc.
When taken together, there’s solid evidence that Republicans do a lot worse with managing STD rates. However, most liberals might write this and other indicators off as more of an effect of health care and poverty, both of which Dem’s have a strong lead on. Personally, I agree.
However, with this and other indicators it’s worth noting that Republicans often believe that other factors besides just economic prosperity play a big role, for instance family or Christian values. The biggest example of this is abstinence education as a way to combat pregnancy and STDs. This relies purely on appeal to one’s morality and self control, plus social stigma. Liberals, in contrast, usually try to withhold moral judgment and focus on mitigating harmful effects with awareness and condoms. In so far as conservatives put their theory forward, the data above suggests they’re wrong.
But as mentioned above with Infant Mortality, Conservatives may not ultimately care about negative outcomes as long as they can implement moralistic policy.
Model & Failed States – Top & Bottom 5
60% of the Model States are Blue, making Democrat the minor winner.
And 80% of Failed States are Red, providing Democrats a major win.
The Good & Bad Baskets – Top & Bottom 15
60% of the Good Basket are Blue, giving Democrats a second minor win.
And 53% of the Bad Basket are Red, giving Democrats yet another minor win.
States Making America Great – Percent Above US Average
Lastly, 65% of Blue States and 50% of Red States are Making America Great. So Democrats are technically the minor winner.
Adult Obesity
Again, Democrats do vastly better than Republicans in 2018 with a much lower rate of adult obesity.


These last two indicators don’t have the same moral implications as STDs do, but they nonetheless have social components.
For obesity, there’s a clear genetic influence for many people. However, I haven’t found anything to suggest that this genetic connection is much different across states or is related to a state’s politics. Therefore, it shouldn’t affect this study.
Other than genetics, health eating and exercise have the biggest influence on obesity. Making some assumptions and adding a bit of a moral layer, we might suggest that states with higher obesity are lazier and/or have lower self control. Again, I’m engaging in a bit more conservative reasoning about health crises.
Model & Failed States – Top & Bottom 5
100% of the Model States are Blue, making Democrat the major winner.
Again, 100% of Failed States are Red, and so Democrats are the major winner.
The Good & Bad Baskets – Top & Bottom 15
67% of the Good Basket are Blue, providing Democrats a third major win.
However, 93% of the Bad Basket are Red, giving Democrats yet another major win.
States Making America Great – Percent Above US Average
Lastly, 78% of Blue States but only 25% of Red States are Making America Great. So Democrats are the major winner.
Data Set 1
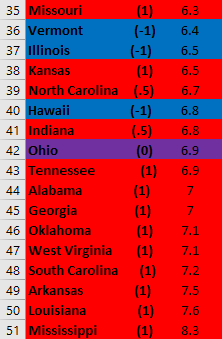
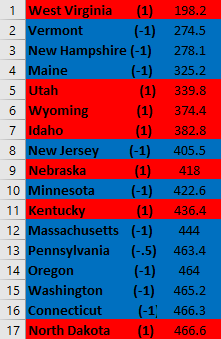
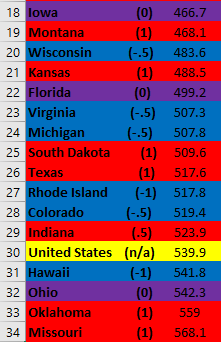
Hypertension Mortality
Unsurprisingly, Democrats are again do vastly better than Republican states on hypertension mortality in 2018.

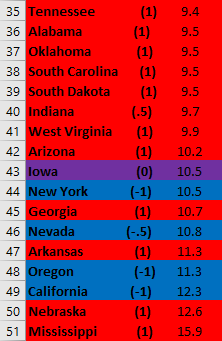
Like obesity, there are a significant genetic and biological factors to hypertension mortality, but also significant social factors. Again diet, and therefore potentially self control and discipline, plays a large role. In addition, chronic psycho-social stress greatly increases an individual’s risk of developing hypertension and hypertension mortality. In this sense, comparative levels of hypertension mortality in a society is a decent indicator of chronic stress there.
While Democrat states do enormously better than Red states, it’s worth noting that there is more of a mix here. While in other metrics Dem’s received all major wins, they get one minor win for failed states. It was also interesting for me to see how badly the two biggest Blue states – Cali and NY – did on this Indicator.
Model & Failed States – Top & Bottom 5
80% of the Model States are Blue, making Democrat the major winner.
but, 60% of Failed States are Red, and so Democrats are the minor winner.
The Good & Bad Baskets – Top & Bottom 15
67% of the Good Basket are Blue, providing Democrats a second major win.
Similarly, 67% of the Bad Basket are Red, giving Democrats yet another major win.
States Making America Great – Percent Above US Average
Lastly, 83% of Blue States and 46% of Red States are Making America Great. So Democrats are again the major winner.
Data Set 1,
Conclusion
At the end of the day, it’s hard to say much about these indicators. Democrats are just vastly healthier.
It may be because of their lower unemployment or better welfare programs, and thus better health insurance coverage. It’s also possible that lower stress, better diets, or more exercise play a role. What’s clear, however, is that Red state’s conservative moralism didn’t help them very much.

Interesting stuff! I wish there were a way to see how, say, the UK, Germany, and Canada slot in to these lists. Everyone knows the US has worse (and more expensive) health outcomes than our peer countries overall, but if our better states get comparable outcomes, that would be a significant datum in the policy discussion I should think.
PS I had also arrived at the conclusion that conservatives favor moralistic policies over outcomes. But I suppose liberals do too: wouldn’t you knock a percent off GDP growth, to see the reduced gains distributed more equitably?
LikeLiked by 1 person
Inequality’s a tricky one! Some equality of outcome is a good indicator of some other things we care about. And equality of opportunity seems more important, even to conservatives.
I actually wrote my undergrad thesis on the debate about whether it’s valuable intrinsically (in itself) or instrumentally (for something else). I shy away from the former and lean towards arguing it’s an important outcome bc it leads to things like more social mobility (which is also instrumentally valuable) and greater “happiness,” since ppl compare themselves to others and what’s possible.
LikeLike
Pingback: Red Vs Blue States – Who’s Actually Pro-Children? Statistical Analysis of Child Pov, Mortality, & Teen Birth Rates | Applied Sentience·
Pingback: Why Trump and the GOP are burning the entire system down - CiviPress.News·