In comparing the quality of life between Red vs Blue states, I’ll be grouping all 23 indicators into 4 main categories:
- 4 Crimes Indicators,
- 4 Social Indicators,
- 7 Health Indicators
- 8 Economic Indicators.
- Plus the Research Methodology
- And the Summary of All 23 Indicators
Intro Comments
Initially, I searched for a bunch of different social issues, but only found good data sets for the following. All the data I used comes from either the US Census (Divorce Rate) or the CDC (Overdose and Suicide Mortality and Teen Birth).
A ton of indicators on social issues were unfortunately rejected because they were either controversial or I just couldn’t find good data. Social issues I rejected but found some data on include 1) single parent households, 2) abortion, 3) teen pregnancy, 4) hate groups, and 5) self-reported happiness. For what makes an indicator “controversial” or a data set “good,” please check out my Methodology article. I will also write up all of these Controversial Indicators (coming soon) and others in a separate post.
As a related note, I’d like to discuss state comparisons on the Teen Birth rate, specifically how it relates to Abortion and Teen Pregnancy. I really wanted to include Teen Pregnancy rates, since a state’s Teen Birth rate is skewed by its Abortion rate, and a lot of conservatives are willing to bite the bullet and accept more teenage moms / foster kids if it means less abortions.
However, I’m still including Teen Birth rates since it fits my method for inclusion. 1) Both liberals and conservatives want a lower Teen Birth rate, all things considered. 2) It’s easy enough to measure and I found a good data set on it. Data on Abortion rates fail on both #1 and #2 and Teen Pregnancy fail on #2. I also consulted with conservative friends and family who accepted or agreed with this reasoning.
Any which way, you can always check out my state comparisons on both Abortion and Teen Pregnancy in the Controversial Indicators post.
All that being said, here’s the original Excel document I used for all four Social Indicators. It contains links to all of the data sets and other details. In the Controversial Indicators post, you can find its respective Excel document.
TL ; DR!
*Note: Parties can do “vastly,” “clearly,” or “slightly” better
Divorce – Democrats do Vastly Better
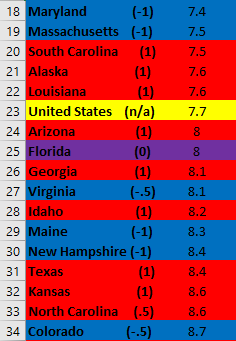
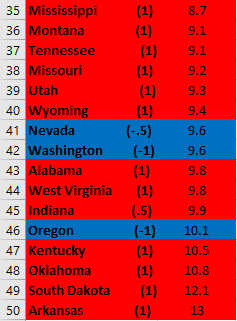
Overdose Mortality – Republicans do Vastly Better
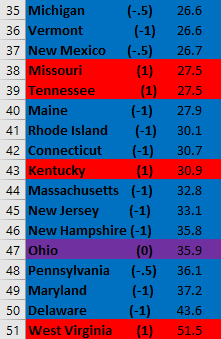
Suicide Mortality – Democrats do Vastly Better
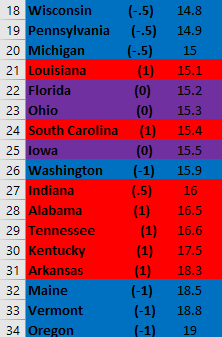
Teen Births – Democrats do Vastly Better
Divorce
It might come as a shock to many Republicans, but Democrats decisively won all 5 measures comparing states’ Divorce rates. There’s simply no contest that Blue states do better here.

I’d first like to note that in the Census data I found, no information was available for Delaware for 2018. However, the victory here is so decisive that even if it ranked last, it wouldn’t substantively change the results.
Personally, these stark findings surprised me a bit. I suspected that Blue states would do better because I know they’re wealthier and financial stability is one of the biggest stressors for a marriage. However, I thought conservative stigma regarding divorce might balance this some and/or maybe liberals would be flippant about splitting up.
Regardless, I’m not in the business of discussing causation here. But in so far as political ideology is important: Democrats do a lot better.
Data Set 1
Model & Failed States – Top & Bottom 5
80% are the Model States are Blue, making Democrats the major winner of this first metric.
Similarly, 80% of Failed States are Red, again making Democrats the major winner.
The Good & Bad Baskets – Top & Bottom 15
80% of the Good Basket are also Blue, giving Democrats a streak of major wins
And, once again, 80% of the Bad Basket are Red, giving Democrats another major win.
States Making America Great – Percent Above US Average
65% of Blue States but only 21% of Red States are Making America Great. So, as you might’ve expected, Democrats are the major winner.
*For more on how and why I made these calculations or terms used, please check out the bottom of the Methodology page.
Drug Overdose Mortality
In a surprise to some but not others, Republicans have a solid win with lower overdose mortality than Democrat states.


I’d first like to acknowledge the discussion of whether this is a social or health issue. Personally, I’d put it in the latter, since I believe in a more medical model of addiction. However, conservatives tend to see it as a social issue. And in a sense, all 23 indicators are actually “social issues” anyway. (Also… I simply needed more social indicators since most of those I searched for didn’t have the best data sets.)
I was fairly surprised myself that Red states are decisively better on this indicator. I thought Democrats would win this since I was imagining the opioid epidemic hitting Red states worse and that Blue states would have better health care systems to avoid mortality.
However, and this is just a guess,
- I know that most overdoses happen after addicts leave rehab and relapse but don’t account for how much their tolerance has changed. So, counter-intuitively, having more access to rehab clinics drives overdose mortality up!
- Another guess is that people have more cash to start expensive drug habits in wealthier Blue states and/or drug dealers, like all capitalists, focus their attention on denser, wealthier markets.
- However, I’m sure that conservatives’ greater stigma against drug use plays a role as well.
I’d love to look at drug use and addiction diagnosis rates, especially data for alcohol abuse, all of which might be completely different than mortality. But alas couldn’t find any good data (yet). I also excluded arrest rates because that’s more contingent on policing than drug use.
Data Set 1
Model & Failed States – Top & Bottom 5
80% are the Model States are Red, making Republicans the major winner.
And 60% of Failed States are Blue, making Republicans the minor winner.
The Good & Bad Baskets – Top & Bottom 15
67% of the Good Basket are also Red, giving Republicans another major win
Similarly, 67% of the Bad Basket are Blue, giving Republicans a third major win.
States Making America Great – Percent Above US Average
40% of Blue States and 58% of Red States are Making America Great. So, as expected, Republicans are the major winner.
Suicide Mortality
Blue states have their second decisive win over Red states with lower suicide mortality in 2018.

Again, like drug addiction, suicidality is an important health issue too. However, there’s no reason to expect that endogenous (more internal, biologically caused) depression is varies bt states or is affected by politics. They all likely have the same rate of this. Therefore, different rates in suicide attempts and mortality might be caused by more social or environmental factors, like different rates of exogneous depression, social supports, religiosity, mental health care accessibility, stigma, etc.
I’d like to note that I chose suicide mortality over attempts because the former is easier to measure and I simply found better data on it. One person I spoke with mentioned that higher mortality might be caused by higher gun ownership in Red states. To this I replied, “Well, if so then it’s a point against gun ownership, an important conservative issue.”
*Quick Methodology note on the “Making America Great” measure: this is only a minor win for Democrats, despite having 3x as many states above the US average, because a major win requires a majority above this line.
Data Set 1
Model & Failed States – Top & Bottom 5
100% are the Model States are Blue, making Democrats the major winner.
And 80% of Failed States are Red, making Democrats the major winner.
The Good & Bad Baskets – Top & Bottom 15
73% of the Good Basket are also Blue, giving Democrats another major win
Similarly, 67% of the Bad Basket are Red, giving Democrats a third major win.
States Making America Great – Percent Above US Average
48% of Blue States and 17% of Red States are Making America Great. So, technically, Democrats are the minor winner.
Teen Birth Rate
Democrats decisively won this admittedly controversial topic for 2018.


To repeat what I wrote at the beginning, this should all be taken with a grain of salt. It’s included because it’s the only metric with good data (compared to teen pregnancy and abortion rates) and because both Democrats and Republicans want fewer teen moms and kids in foster care. And again, teen pregnancy, abortion, and single parents are all analyzed and discussed in the Controversial Indicators post.
So, if abortion is a huge issue for you, and you’re willing to bite the bullet, at very least this data proves that Red states are currently biting it. You may also want to look at other child-centered indicators, like infant mortality and child poverty I’ve included in other categories.
Data Set 1
Model & Failed States – Top & Bottom 5
100% are the Model States are Blue, making Democrats the major winner.
And again 100% of Failed States are Red, making Democrats the major winner.
The Good & Bad Baskets – Top & Bottom 15
93% of the Good Basket are Blue, giving Democrats a major win
Similarly, 93% of the Bad Basket are Red, giving Democrats a fourth major win.
States Making America Great – Percent Above US Average
91% of Blue States and 21% of Red States are Making America Great. So, unsurprisingly at this point, Democrats are the major winner.
Conclusion
While, Social Issues were definitely the trickiest of the four categories, with most initial indicators being sent to the Controversial Indicators group, it’s still the case that I found some important ones both sides agree on.
Among these, I’d like to note that, while there are obviously a ton of factors, conservatives’ moralism didn’t save them. The biggest conservative moralistic issues, imo – suicide and divorce – Red states completely bombed. For both indicators, a Blue state was a whopping 3x more likely to be above the US average than a Red state. Similarly for teen pregnancy, while abortion may skew the numbers in Blue states’ favor, conservatives’ moralistic abstinence programs didn’t save Red states. As I’ve mentioned before, this study doesn’t get into causal pathways. But I’d personally conclude that it is a strike against not just conservative policy, but also conservative morality.

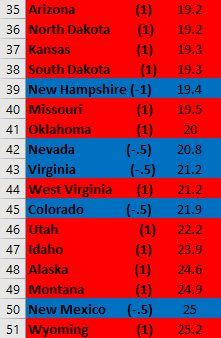
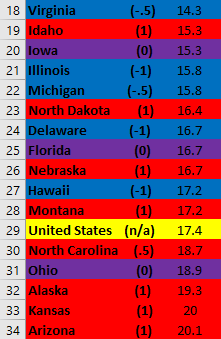
I’m trying to recall from the last post – the center column is partisan lean, and the right column is incidence per 100k residents (or so)?
Interesting stuff, thanks for your work!
LikeLiked by 1 person
The three color coded columns are just copy-pasted from Excel. They’re the ranking of the 1-50 states, plus US average. All stats are either percent of population or rate per 10 or 100k. The linked Excel doc has those details.
LikeLike
oh, sorry, yes! The number in parentheses next to the state is its partisan lean! The range goes from (-1, -.5, 0, .5, 1) and is simply derived from how many times they voted for one or another party in the last 4 elections.
LikeLike
Pingback: Research Methodology — Are Red or Blue States Better? | Applied Sentience·
Pingback: CRIME — Are Red or Blue States Better? | Applied Sentience·
Pingback: 8 Economic Indicators — Are Red or Blue States Better? | Applied Sentience·
Pingback: Summary of 23 Quality of Life Indicators — Are Red or Blue States Better? | Applied Sentience·
I was shocked about blue states faring better with lower divorce rates. And I agree with your point about higher income.
But now I wonder…could the lower divorce rate also have to do alot with more liberal ideas on marriage and family? For example…there may be alot more pressure in red states to marry young or because there’s a child on the way. Perhaps this is pressuring young people to marry before they’re ready or poorly chose their partner because their own desires and personality were not fully realized yet.
Also, my guess is that blue states have more same sex marriage…thus boosting their numbers (and marriage happiness since you can marry who you want).
LikeLiked by 1 person
I also ran the numbers but never published that Blues states also do better with both number of households run by single moms as well as children growing up in single parent households.
Def agree abt the cultural aspect. In the methodology, I discuss how political ideology (red v blue) is not only connected to gov policies, but also culture. I talk about this in some of the other posts in this study.
LikeLike
Pingback: Red Vs Blue States – Who’s Actually Pro-Children? Statistical Analysis of Child Pov, Mortality, & Teen Birth Rates | Applied Sentience·