In comparing the quality of life between Red vs Blue states, I’ll be grouping all 23 indicators into 4 main categories:
- 4 Crimes Indicators,
- 4 Social Indicators,
- 7 Health Indicators
- 8 Economic Indicators.
- Plus the Research Methodology
- And the Summary of All 23 Indicators
Intro Comments
Finding data sets for this one was pretty straightforward. I’ll be exclusively using 2018 data from the FBI’s Uniform Crime Reporting (UCR) Program. However, sometimes the data wasn’t the easiest to track down and also, to reduce tedious data entry, I sometimes used data sets from third parties (like statista.com) which presented it more directly. I’ve provided links to everything in the Excel doc below.
I chose four crimes based off of recommendations from conservative friends / family as well as somewhat at random. Additionally, the FBI splits “Part 1” crimes into two types, violent crimes and property crimes, so I decided to get some variety there as well. All in all, I chose Murder, Forcible Rape, Robbery, and Motor Vehicle Theft.
I’d also like to quickly link to this 2016 Snope’s article debunking a popular set of maps comparing crime and Red vs Blue states.
To learn more about how I chose indicators generally and score everything, as well as other details about this study, please check out my Methodology post. Also, here’s the original Excel document I used for all four Crime Indicators
TL ; DR!
*Note 1: Parties can do “vastly,” “clearly,” or “slightly” better. *Note 2: “Better” as in less crime.
Murder – Democrats do Vastly Better
Rape – Democrats do Slightly Better
Robbery – Republicans do Clearly Better
Car Theft – Democrats do Clearly Better
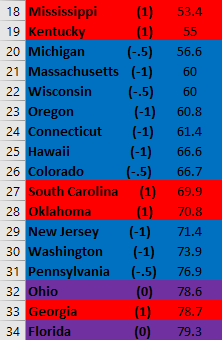
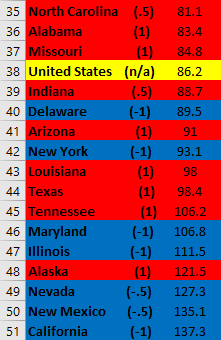
Murder
Democrats won all five metrics on this one, including two major wins, making it clear that they do vastly better than Republicans in 2018.

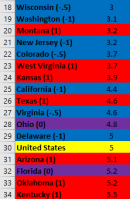

Adding to this solid win, you might notice that 4 out of 6 of the Blue states under the US average have a (.5) next to them. That means they only voted for Democrats in 3 of the last 4 elections, not like (1) states that voted 4 out of 4. Keep an eye out for this, since it isn’t formally accounted for in this study.
A lot of conservatives I’ve spoken to predicted the opposite results – Republicans would clearly win. As I personally understand it, these people hear about awful spikes in cities, read: Blue, with headlines reading something like “12 murdered over the weekend.”
However, not only do Red states have cities too, which may do better or worse than Blue state cities, but these headlines take advantage of a common cognitive bias – the availability heuristic. More people are scared of planes because lots of people die in headline making crashes. Nonetheless, you’re much more likely to die in an unremarkable yet vastly more common car accident.
Model & Failed States – Top & Bottom 5
60% are the Model States are Blue, making Democrats the minor winner of this first metric.
Similarly, 60% of Failed States are Red, again making Democrats the minor winner.
The Good & Bad Baskets – Top & Bottom 15
53% of the Good Basket are Blue, making Democrats the minor winner here.
Similarly, 67% of the Bad Basket are Red, this time giving Democrats a major win.
States Making America Great – Percent Above US Average
74% of Blue States but only 42% of Red States are Making America Great. So again, Democrats are the major winner.
*For more on how and why I made these calculations or terms used, please check out the bottom of the Methodology page.
Forcible Rape
This is the weakest win of the bunch, but still a fairly clear win for Democrats in 2018. As you can see, although Republicans lose the category as a whole, they have two minor wins in the first metrics. However, Democrats clearly win the next three metrics, including two major wins.
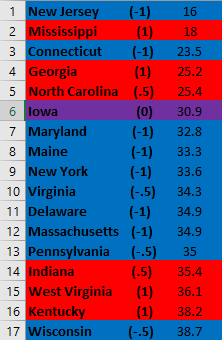

What seems to be the case is that there’s decently solid trend that Dem’s do better, but that there are atypical outliers on both ends, i.e. a few Republican states that do particularly well and a few Dem’s do particular poorly. However, the greatest outliers, first and last place, fit the overall trend.
It should also be noted that all of the worst Dem states are (.5)’s, meaning they’ve recently voted Republican.
Model & Failed States – Top & Bottom 5
60% are the Model States are Red this time, making Republicans the minor winner.
Similarly, 60% of Failed States are Blue, again making Republicans the minor winner.
The Good & Bad Baskets – Top & Bottom 15
60% of the Good Basket, however, are Blue, making Democrats the minor winner here.
Similarly, 73% of the Bad Basket are Red, this time giving Democrats a major win.
States Making America Great – Percent Above US Average
Last, but not least, 52% of Blue States but only 38% of Red States are Making America Great. So Democrats are the major winner here.
Robbery
Republicans get their first win and do better with robbery (theft with the threat or use of force) in 2018.
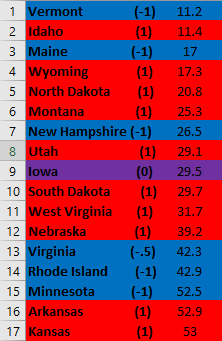
According to the rating system I came up with before doing any of this analysis, this appears to be a stronger win for Red than the last indicator was for Blue’s. However, the wins are a lot closer (1 state would flip each result) and in Red’s only major win, 2 of the 5 Dems there are (.5)’s.
It’s certainly a win for Reds, but it’s an example of an ask I’d like to make: if anyone ever has the time, it’d be interesting to parse apart the data with 5 instead of 3 hues, as mentioned in the Methodology post, and also look into magnitude of difference bt states.
Model & Failed States – Top & Bottom 5
60% are the Model States are Red, making Republicans the minor winner.
Similarly, 80% of Failed States are Blue, again making Republicans the major winner.
The Good & Bad Baskets – Top & Bottom 15
53% of the Good Basket, are Red, making Republicans the minor winner here.
Interestingly enough, 53% of the Bad Basket are also Red, providing Democrats a minor win.
States Making America Great – Percent Above US Average
And almost at a tie, 70% of Blue States and 75% of Red States are Making America Great. So Republicans are the minor winner here.
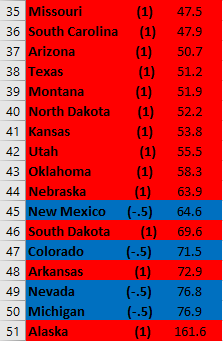
Motor Vehicle Theft
Close but not quite as well as murder, Democrats clearly do better (lower rate of car thefts) than Republican states in 2018.

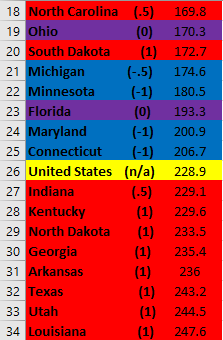
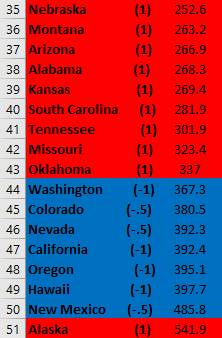
This is the first indicator where the losing political party has a major win, namely a lot more Democrats that are Failed States. However, given that they have a 100% lead among Model States, the other side of that coin, and win all other categories, including 3 major wins, Democrats are still clearly the winner here. For instance, a Blue state is almost 3 times more likely to be above the US average compared to a Red state!
Model & Failed States – Top & Bottom 5
100% of the Model States are Blue, making Democrats the major winner.
However, 80% of Failed States are also Blue, again making Republicans the major winner.
The Good & Bad Baskets – Top & Bottom 15
67% of the Good Basket are Blue, making Democrats the major winner.
And 53% of the Bad Basket are Red, providing Democrats a minor win.
States Making America Great – Percent Above US Average
And finally, 70% of Blue States and 25% of Red States are Making America Great. So Democrats are the major winner by a huge lead.
Conclusion
Democrats do a lot better on Crime. This isn’t an absolutely crushing victory, but they did win 3 of the 4 indicators, and at least one or two of those fairly decisively.
Most importantly, murder is often considered one of the worst crimes a person can commit, and in this study it’s also the indicator that was most decisively won. Some may argue forcible rape is just as bad or worse, which I don’t disagree with. But again, Democrat states appear to do better.

Pingback: Research Methodology — Are Red or Blue States Better? | Applied Sentience·
Pingback: SOCIAL ISSUES — Are Red or Blue States Better? | Applied Sentience·
Pingback: 8 Economic Indicators — Are Red or Blue States Better? | Applied Sentience·
Pingback: Summary of 23 Quality of Life Indicators — Are Red or Blue States Better? | Applied Sentience·
Imagine if the Republican leadership did not totally obstruct the American’s Democratic Party representative’s agendas over these last four decades; since the entire Republican Party Leadership was taken over by an organized wealthy few fatcat pirate’s & privateers of U.S & Global industries & markets! Literally un-doing our Greatest Generation’s of American’s! Progressive, New Deal Era! Which created the American Middle Class! Which did’nt exist until the New deal Passed in 1934!
LikeLike
Whoa, calm down Boomer. Just because you fantasize about everything being great back in the 1930s, doesn’t make it true.
LikeLike
However, if you drill down to a more local level (cities, districts, etc) it paints a vastly different picture. Chicago, alone, represents 1 in 8 murders, across the entire country. When you drop the State distraction and look at Liberal strongholds, you see a completely different picture.
LikeLike
You should check your sources.
Chicago isn’t even the worst city. Quite a few have higher murder rates – https://worldpopulationreview.com/us-city-rankings/cities-with-most-murders
Also, it’s not a liberal or city issue either. Mississippi and Chicago have about the same population, but Mississippi’s murder rate is about 10% higher – https://www.cdc.gov/nchs/pressroom/sosmap/homicide_mortality/homicide.htm
LikeLike
Maybe you should check yours!
There are ZERO data sources listed in that World Population Review article to back up their stats. Did they pull them out of thin air?
Next, the CDC article only lists homicide rates for STATES, not CITIES. Comparing homicide rates between states and cities based on the number of people in them is like comparing accident rates between cars in suburbs and cities based on the number of people in them.
THEY’RE NOT COMPARABLE AREAS!
The big part you missed is that many red states have very blue cities within them that drive the state’s homicide rate – just as they did with COVID rates.
LikeLike
I’ll have to look into the WPR sources. But most lists I look at say the same. Here are the top google searches that come up
1) https://en.wikipedia.org/wiki/List_of_United_States_cities_by_crime_rate
2) https://www.cbsnews.com/pictures/murder-map-deadliest-u-s-cities/
3) https://www.thetrace.org/2018/04/highest-murder-rates-us-cities-list/
4) https://www.safehome.org/resources/crime-statistics-by-state/
Sure there are lots of reasons you can’t compare the city of Chicago vs vs state of Mississippi. My point is abt GOP hypocrisy. So let me ask you a quick question – why’s the GOP constantly freaking out abt Chicago and not Mississippi? I mean, the rate’s higher in the latter.
LikeLike
About your blue cities point.
1) I focused on Mississippi bc it has no cities. Well, unless count Jackson w 160k ppl. But that’s an order of magnitude, or even two, smaller than some of the cities we’re talking about. Chicago is almost 20x larger.
2) You’re also not factoring in that “blue” is relative. The “redder” rural areas in Vermont are probably more liberal than “bluer” mini-cities of Mississippi. There isn’t just one blue, but many shades.
3) Cities don’t get to make their own rules, but are subject to state legislation. Red state cities have redder state laws.
LikeLike
Keep in mind blue states have underreporting issues when it comes to crime and crimes go unreported. Also there’s constant rioting and bs in the streets in blue states.
LikeLike
Thanks for pointing this out and the link! However, I’m not sure it shows what you think it does.
1) The FBI data I use is not absolute numbers, which relative under reporting would definitely affect, but per capita or percentage numbers, which under reporting may or may not affect. And if it affects it, the rate might equally go up as down.
2) According to your article, Florida is the worse state for reporting, which in my data is Purple, and now solidly Red.
3) One of and sometimes the best Red state, ie lowest crime, is Mississippi, which is on your top ten worst reporters.
4) Most of the states that report 100% of data are Blue and also have low violent crime rates, eg Connecticut and Vermont.
5) All in all, of the 10 worst states, yes most are Blue. However, we’d need to see all the results before saying Blue states are worse on average than Red at reporting. Much more that the magnitude of difference in reporting is enough to account for the magnitude of difference in crime rates.
LikeLike
https://www.axios.com/local/san-francisco/2022/11/29/california-fbi-crime-data-reporting
LikeLike